Balance. Life is all about balance. In order to make more informed (and ultimately more profitable) marketing decisions for your consultant website, you must conduct the research to back them.
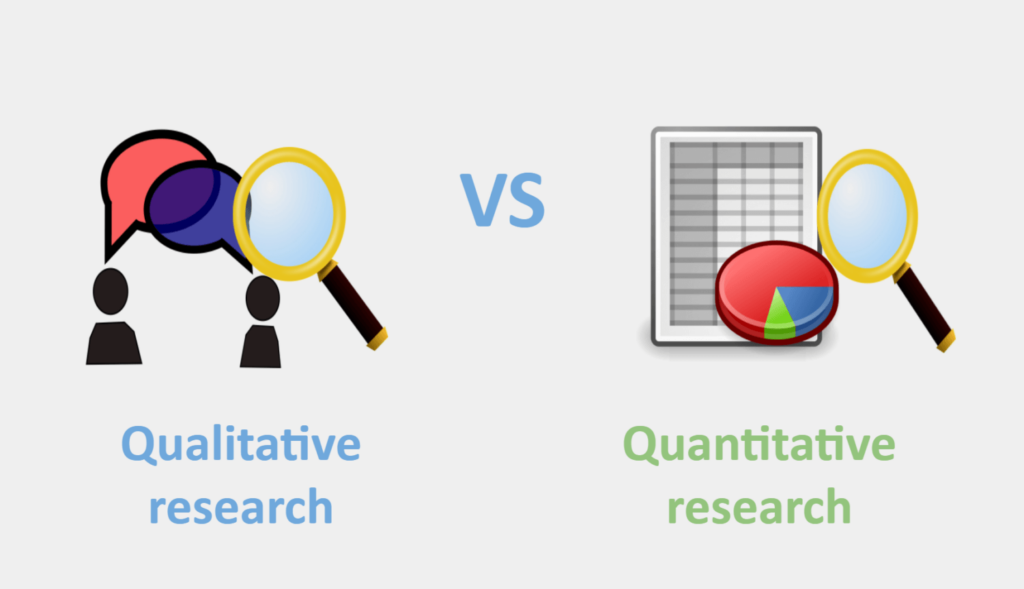
There are two ways to do this: Quantitative, and Qualitative research. These are very different forms of research, each of which will provide you with distinct answers to your questions.
But, you don’t have to choose one over the other. To create the most effective digital marketing strategy possible, you must balance them together. Both qualitative and quantitative research have a role to play in helping you make the best decisions for your business.
Together they will give you a FULL picture of what your customers want.
So read on to discover everything you need to know about how to use both qualitative and quantitative research to build an effective digital marketing strategy.
Quantitative
There are many differences between qualitative and quantitative research.
But, when you use the two together, the differences are what make for a stronger marketing strategy.
Before we talk about how these two forms of research come together to strengthen your overall strategy, let’s take a look at the definition of each, as well as when you can use it in your marketing.
Quantitative research defined
Quantitative research helps you gather data in measurable or numerical form.
The research is all about numbers and it uses mathematical analysis to help shed light on crucial statistics pertaining to your business and market.
This type of research gives you hard data in an organized manner which you can then analyze to help you make well-thought-out decisions for improving your brand, products, and services.
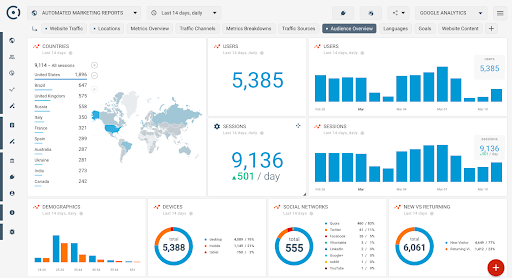
Common quantitative sources for digital marketers:
- Google Analytics (and other web analytics tools)
- Smartlook
- Social Surveys
- Closed Questionnaires
- Structured Interviews
- Company Accounts
- Official Statistics
- Observations
As you can see, there are many different ways of conducting quantitative research.
However, regardless of the source, the data produced is always numerical and analysis is done through mathematical or statistical methods.
In short, if there are no numbers involved, it’s probably NOT quantitative research.

Analyzing quantitative data
There are tons of different statistical techniques you can use to analyze quantitative data.
These can be statistical significance or even simple graphs that show the data through tests of correlations of two or more items. An example of a statistical significance graph is below.
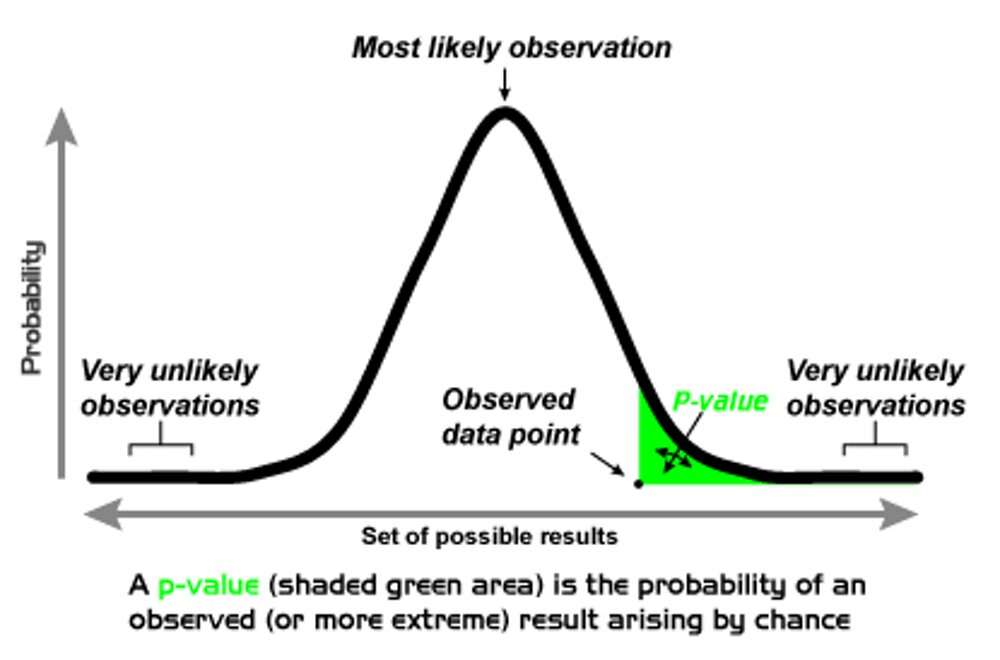
You can also use hypothesis testing where you identify whether or not there are genuine differences between groups. Below is an example of a hypothesis testing graph.

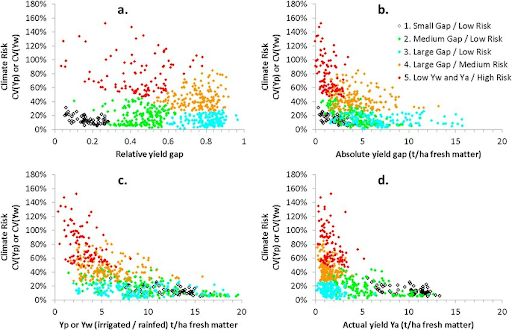
Cluster analysis is yet another method that is useful for identifying relationships between different subjects or groups where there isn’t any obvious hypothesis. Below is an example of a cluster analysis.
Although there are many different ways of conducting quantitative research and analyzing the data, it’s important to keep in mind that quantitative methods aren’t always the most suitable for investigation.
For instance, they’re not likely to be helpful if your goal is to understand the detailed reasons behind a particular behavior. And, it may be possible that assigning numbers to abstract constructs (like personal opinions, for instance) risks making them unreliable.
When to use quantitative research in your marketing
Quantitative research is particularly useful for marketing consultants and coaches as well as any marketer creating a digital marketing strategy. Afterall, for marketers, numerical data is viewed as the gold standard for building successful marketing campaigns.
If, for example, a consultant finds that a company is using Facebook Ads and Google Ads that link to the same target webpage, they can look at the total number of people that clicked the link for each.
They can then compare these numbers to the total cost of each of the marketing tools and determine which is most profitable.
If Facebook Ads are producing less results than Google Ads and are more costly, then the marketer might reduce the investment in the latter and increase the investment in the former. This would likely produce greater results and lead to higher ROI for the company.
Possessing quantitative data such as this will greatly improve your digital marketing strategy as a consultant.
Here are some things that quantitative research can tell you:
- Whether there is a market for your service
- The level of awareness there is for your brand
- The number of people interested in your service
- Insights into your ideal customers
- The buying habits of your target customers
- How the needs of your target market are changing
When you can see things like the actual number of website visitors, or how many of those people converted into leads, this type of information can help inform your current and future marketing strategies.
Important note: Not all phenomena can lend themselves easily to quantitative analysis.
Furthermore, there are times when quantitative data will need to be produced from qualitative phenomena. While some are already available in numerical form (e.g. the number of email subscribers), others are not so obvious (e.g. user opinions). But, even these can still be measured using quantitative methods.
For example:
- Say you wanted to turn opinions into numbers by carrying out a statistical analysis of people’s opinions about one of your products.
- You might ask them to express their relative satisfaction with the different features on a scale of 1 to 10 where 1 is highly unsatisfied and 10 is highly satisfied.
- Such a scale, known as the Likert scale, helps you translate statements of opinion into numerical data.
There are several ways in which a Likert scale can be used to gather this data. For example, a text slider such as the one below may be used:
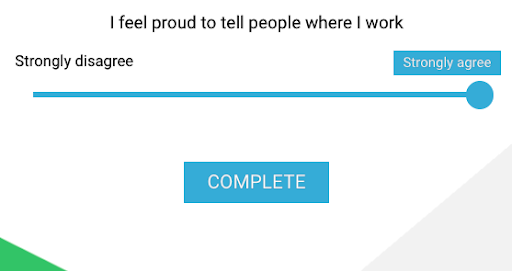
The consumer of the company’s product can slide the dot along the line to mark their level of agreement with a certain statement. These statements can then be converted into quantitative data.
Where “Strongly Disagree” could be converted into a 1, “Strongly Agree” could be converted into a 5 with three other values in between (“Disagree,” “Agree,” and “Neutral”).
Each of these values, in turn, could be converted into a 2, 3, or 4. The consultant might average the quantitative data and convert it back to qualitative data for the client.
If their result indicated a 4.2, the consultant could say that the majority of consumers agree with a given statement such as “I found this product useful.”
Qualitative
Now that you understand how crucial it is to have reliable quantitative sources that help inform your digital marketing strategies, let’s take a look at what you need to know about qualitative research.
Qualitative research defined
Qualitative research is very different from quantitative.
This type of research doesn’t involve numbers or collecting numerical data, but rather it relies on observing and collecting non-numerical insights, like opinions and motivations, so you can explore more in-depth ideas.
It often involves language or words, but it can also use photographs, pictures, and observations.
In some cases, opinions, motivations, and other qualitative phenomena can be converted into quantitative data by using Likert scales and other tools as shown above; however, this is not always the case.
There are instances where qualitative data is preferred over numbers and statistics.
One benefit of qualitative data is that it is possible to examine almost ANY phenomenon in a qualitative way while much less phenomena can be examined in a quantitative way..
Common qualitative sources for digital marketers:
Open-ended Customer Surveys: These allow you to learn about your customer’s pain points by allowing them to respond in their own words.
- Interviews: These can be structured, unstructured, or semi-structured interviews.
- Secondary data: This includes diaries, company reports, written accounts of events, and so on.
- Focus Groups: These involve multiple participants who were brought together to discuss an issue.
- Observations: These may be done under “laboratory conditions” or on-site. For instance, participants might be asked to role-play scenarios to show the decisions they might take in different situations.
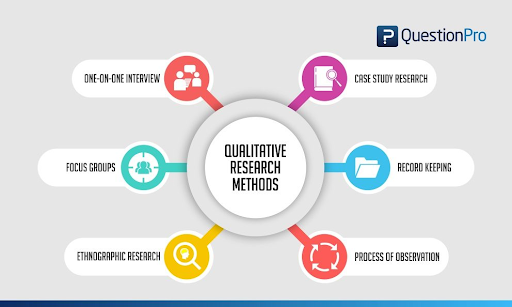
These are just a few of the common qualitative research methods you can use as a consultant to help you make better decisions in your marketing.
Analyzing qualitative data
Since qualitative data comes from a wide variety of sources, the results can be dramatically different in scope.
There are just as many different ways of analyzing data from qualitative analysis, many of which involve coding and structuring the data into themes and groups.
These days, there are also tons of computer packages designed to support qualitative data analysis.
Your work is to work out the best one for your business depending on your specific needs for collating and analyzing data.
When to use qualitative research in your marketing
Qualitative analysis generates rich data that offers a fuller, in-depth picture. It’s particularly useful for exploring why and how things happen in your business.
For instance, if you worked at a career-focused website and wanted to put together a qualitative research study about how it is to work at Instacart, you would ideally contact 50-100+ shoppers and not only ask how much Instacart pays their shoppers, but also the employee thoughts on working for the company.
Here are some other instances where you might find qualitative research useful:
- When you want to understand the intent behind a search
- When you want to gain insights into why potential clients visit a specific area of your website
- When you want to discover whether they completed the task they were looking to complete
- If there is a high bounce rate on your site and you want to get the context
- If you want to discover which product features your customers find most interesting
- If you want insights into your clients’ frustrations and desires
This type of research can help you discover the answers to all these questions and more.
For instance, if there is an error on your website that needs to be fixed, qualitative research will help you find it. It may even be that the error is hard to detect otherwise, but these strategies will help you discover it in no time.
Or, you could also use qualitative research to speak with your website visitors and understand how and why they use the website. While this may require that you host a webinar to understand their situation and speak to them directly, the insights can be substantial.
Having said that, it’s important to note that there are some drawbacks to qualitative research. For instance, when respondents don’t see any kind of value for them in your research, they may provide false or inaccurate information. Some respondents may even provide information that they think researchers want to hear. This is called the “social desirability bias”.
Of course, there are ways to get around such problems.
For one, qualitative researchers can take the time to build relationships with each of their research subjects as a way to lessen the potential for them to provide inaccurate answers.
Qualitative vs. quantitative: bringing it all together
Your sources of research don’t always have to be either quantitative OR qualitative.
For instance, it’s possible to send out a standard NPS (Net Promoter Score) survey to customers including both types of questions, such as:
Quantitative questions like:
“On a scale of 0 to 10, how likely are customers to recommend your product or service?”
And qualitative questions, such as:
“What is the reason for their score?”
This is just one way to use qualitative and quantitative and quantitative sources together.
Asking both types of questions is useful because while you may get the answers to the “what” from quantitative data, you probably won’t understand the “why“.
For example:
Google Analytics will show you the number of visitors that came to your website, but it won’t tell you why they clicked on your particular search results.
Another example in email marketing:
An email service provider like MailChimp might deliver statistics on open rates and clicks, but it won’t tell you anything about the particular words or phrases in your subject line or email copy that inspired those opens or clicks.
Qualitative research will allow you to prevent narrative fallacies that attempt to explain without the data to support them.
For instance, say your quantitative research shows you that the bounce rate is quite high for one of your service pages. You might then assume that the reason is that the images aren’t very appealing. Your next thought might be to get new hero images.
That is an example of a narrative fallacy: Drawing conclusions without any data to support them. In actual fact, it could be that your bounce rate is high because your tracking isn’t performing as well as it should.
Maybe the page has an inadequate number of internal links. Or, it could even be that the headline isn’t aligned with the target user intent. In fact, it could be any of a hundred different reasons.
If you are serious about improving and optimizing your website, or building authority with your blog, the use of qualitative research together with quantitative analysis will help you avoid those narrative fallacies that could otherwise undermine your work. The use case below will help you get a better understanding of how to use qualitative and quantitative user research:
Qualitative and quantitative research use case: website redesign
Redesigning a website involves taking on a huge risk. For the most part, the decisions surrounding the redesign come from the highest-paid person.
This means that, after years spent making small, data-based changes to a website, all that work can be thrown away with a major redesign.
This is otherwise known as “radical” versus “iterative” redesign – that is, the difference between the small changes along the way, and the major redesign. Sticking to smaller changes makes it less likely that you’ll waste money changing the website only to have it perform even worse.
But still, there are certain situations that require a major redesign, such as when:
- You make a huge shift in your brand or service
- You’ve reached “local maxima” for your website, whereby you’ve exhausted ALL opportunities for iterative redesign
- You lack the level of traffic required to get the data you need from running A/B tests
Regardless of the approach you choose, research is still essential. And in such a case, it may also be the best way to protect your website during radical redesign.
The use of quantitative and qualitative data together can help justify the design and copy choices that are most likely to please and satisfy users (and ultimately make your business more money).
Summary
Quantitative and qualitative research must be balanced together in order to create the most effective digital marketing strategy for clients.
Marketers need to be able assess both what happened using quantitative data such as number and statistics while also using qualitative data to assess why certain actions were taken.
Both quantitative and qualitative data have their drawbacks, especially when used alone, but when they are brought together, the benefits of both become magnified.
Remember that an effective digital marketing strategy must remain balanced and that balance is generated from the combined use of quantitative and qualitative data.